
How to Build a Data Analysis Portfolio (Even with No Job Experience)

We’ve all heard the advice “show, don’t tell”. This doesn’t just apply to creative writing.
Demonstrating your skills using a portfolio or work sample can set your application apart from the rest.
Anyone can write “proficient in Python” or “experience in data visualization” on a resume. When I helped hire an analyst, my department received hundreds of applications from applicants with similar skillsets. The candidates who stood out were the ones who attached portfolios or work samples—we could see their thought processes, technical ability, and communication skills before even scheduling an interview.
I do have to add a caveat: not every recruiter or hiring manager will care about a portfolio (or even look at it). Some organizations prefer to rely on technical interviews or years of experience. However, you never know who will be reviewing your application and what factors help you stand out.
“Where Do I Start?”
Whether you’re looking for your first internship or already have some job experience, portfolios all have the same goal: demonstrate the way you think, analyze, and communicate results.
Ideally, you already have some technical skills relevant to your field. If you know the basics of one or more programming languages or software tool, you are likely ready to start a portfolio. For example:
R is commonly used for academic or medical research, statistics, and data analysis. Some older/more traditional institutions may prefer SAS.
Python is commonly used for data analysis and machine learning workflows in most industries.
SQL is used to query databases and working with structured business or clinical data.
Excel is used in nearly every industry for reporting, quick analysis, and data cleaning, often in conjunction with other specialized software.
Tableau or Power BI are used for dashboards and data visualization, commonly in business settings.
Identify a Research Question
Before getting your hands on data, come up with a research question that relates to your industry of interest. At this stage, the question does not have to be complex. You can narrow down and operationalize your question based on publicly available data.
Along with your research question, you should also develop an analysis plan. This maps out the variables you’ll need, the comparisons or relationships you’d like to explore, and how you might visualize the results.
Examples include:
Health: What factors are associated with higher rates of diabetes in the US?
Marketing: What are the main customer segments? How does each segment engage with different campaign types?
Tech: What product features are most predictive of long-term retention?
Finance: What applicant factors are associated with loan approval rates?
Data Sources
One misconception is that portfolios must contain real projects done in a workplace setting. Portfolios can be built entirely from publicly available or self-selected datasets.
Some excellent free data sources:
Kaggle has hundreds of thousands of free-to-use datasets from many fields.
Data.Gov has datasets at the city, state, and federal level covering a wide range of topics.
Awesome Public Datasets has a curated list of datasets (mostly free) arranged by topic.
Datasets used in your coursework / certification courses.
Data you’ve scraped or collected yourself (use caution around legality, terms of use, and data quality).
The Project Itself
A strong portfolio project is clear and structured, showing how you transform raw data into a meaningful conclusion or recommendation.
A portfolio project should include the following:
Headline: A one-line summary of the project stating what you did and why it matters. This provides context to the reader before seeing any details.
Background and cleaning process: What does the dataset contain, what tools did you use, and what cleaning or transformation steps did you need to take before analysis? Include the reasoning behind decisions you made during the analysis, such as removing missing data.
Exploratory analysis: What patterns and trends did you observe?
Main analysis: This part will vary in complexity, but may include statistical tests, models, dashboards, etc. based on your research question.
Results and interpretation: What did you find, and what do the results mean in the context of your research question? What would you suggest to stakeholders or decision-makers? What does your final dashboard look like?
Showing & Sharing Your Work
There is not one “right” way to save and share your portfolio projects. The goal is to make your work easy to understand and evaluate. I’ll list a few options below.
PDF reports or notebooks: These files combine text, code, and output to tell a story from start to finish. This makes it easier for someone reviewing your work to follow your thinking without switching between separate documents. These can be easily attached to your application, alongside a resume and cover letter. Examples include R Markdown and Jupyter notebooks.
Portfolio websites: You can organize multiple projects in one place and add additional information about yourself. Free options include Canva, Notion, Google Sites, and GitHub Pages, among many other great hosting options. This site can be linked on your resume or included in your application if a website is requested.
GitHub repositories: This is a very standard way to share data analysis work. A repository often includes code scripts, README explanations, data/data sources, and output. This can show a hiring manager that you’re familiar with documentation, creating reproducible work, and version control. This can also be linked on your resume or included in your application if a site is requested.
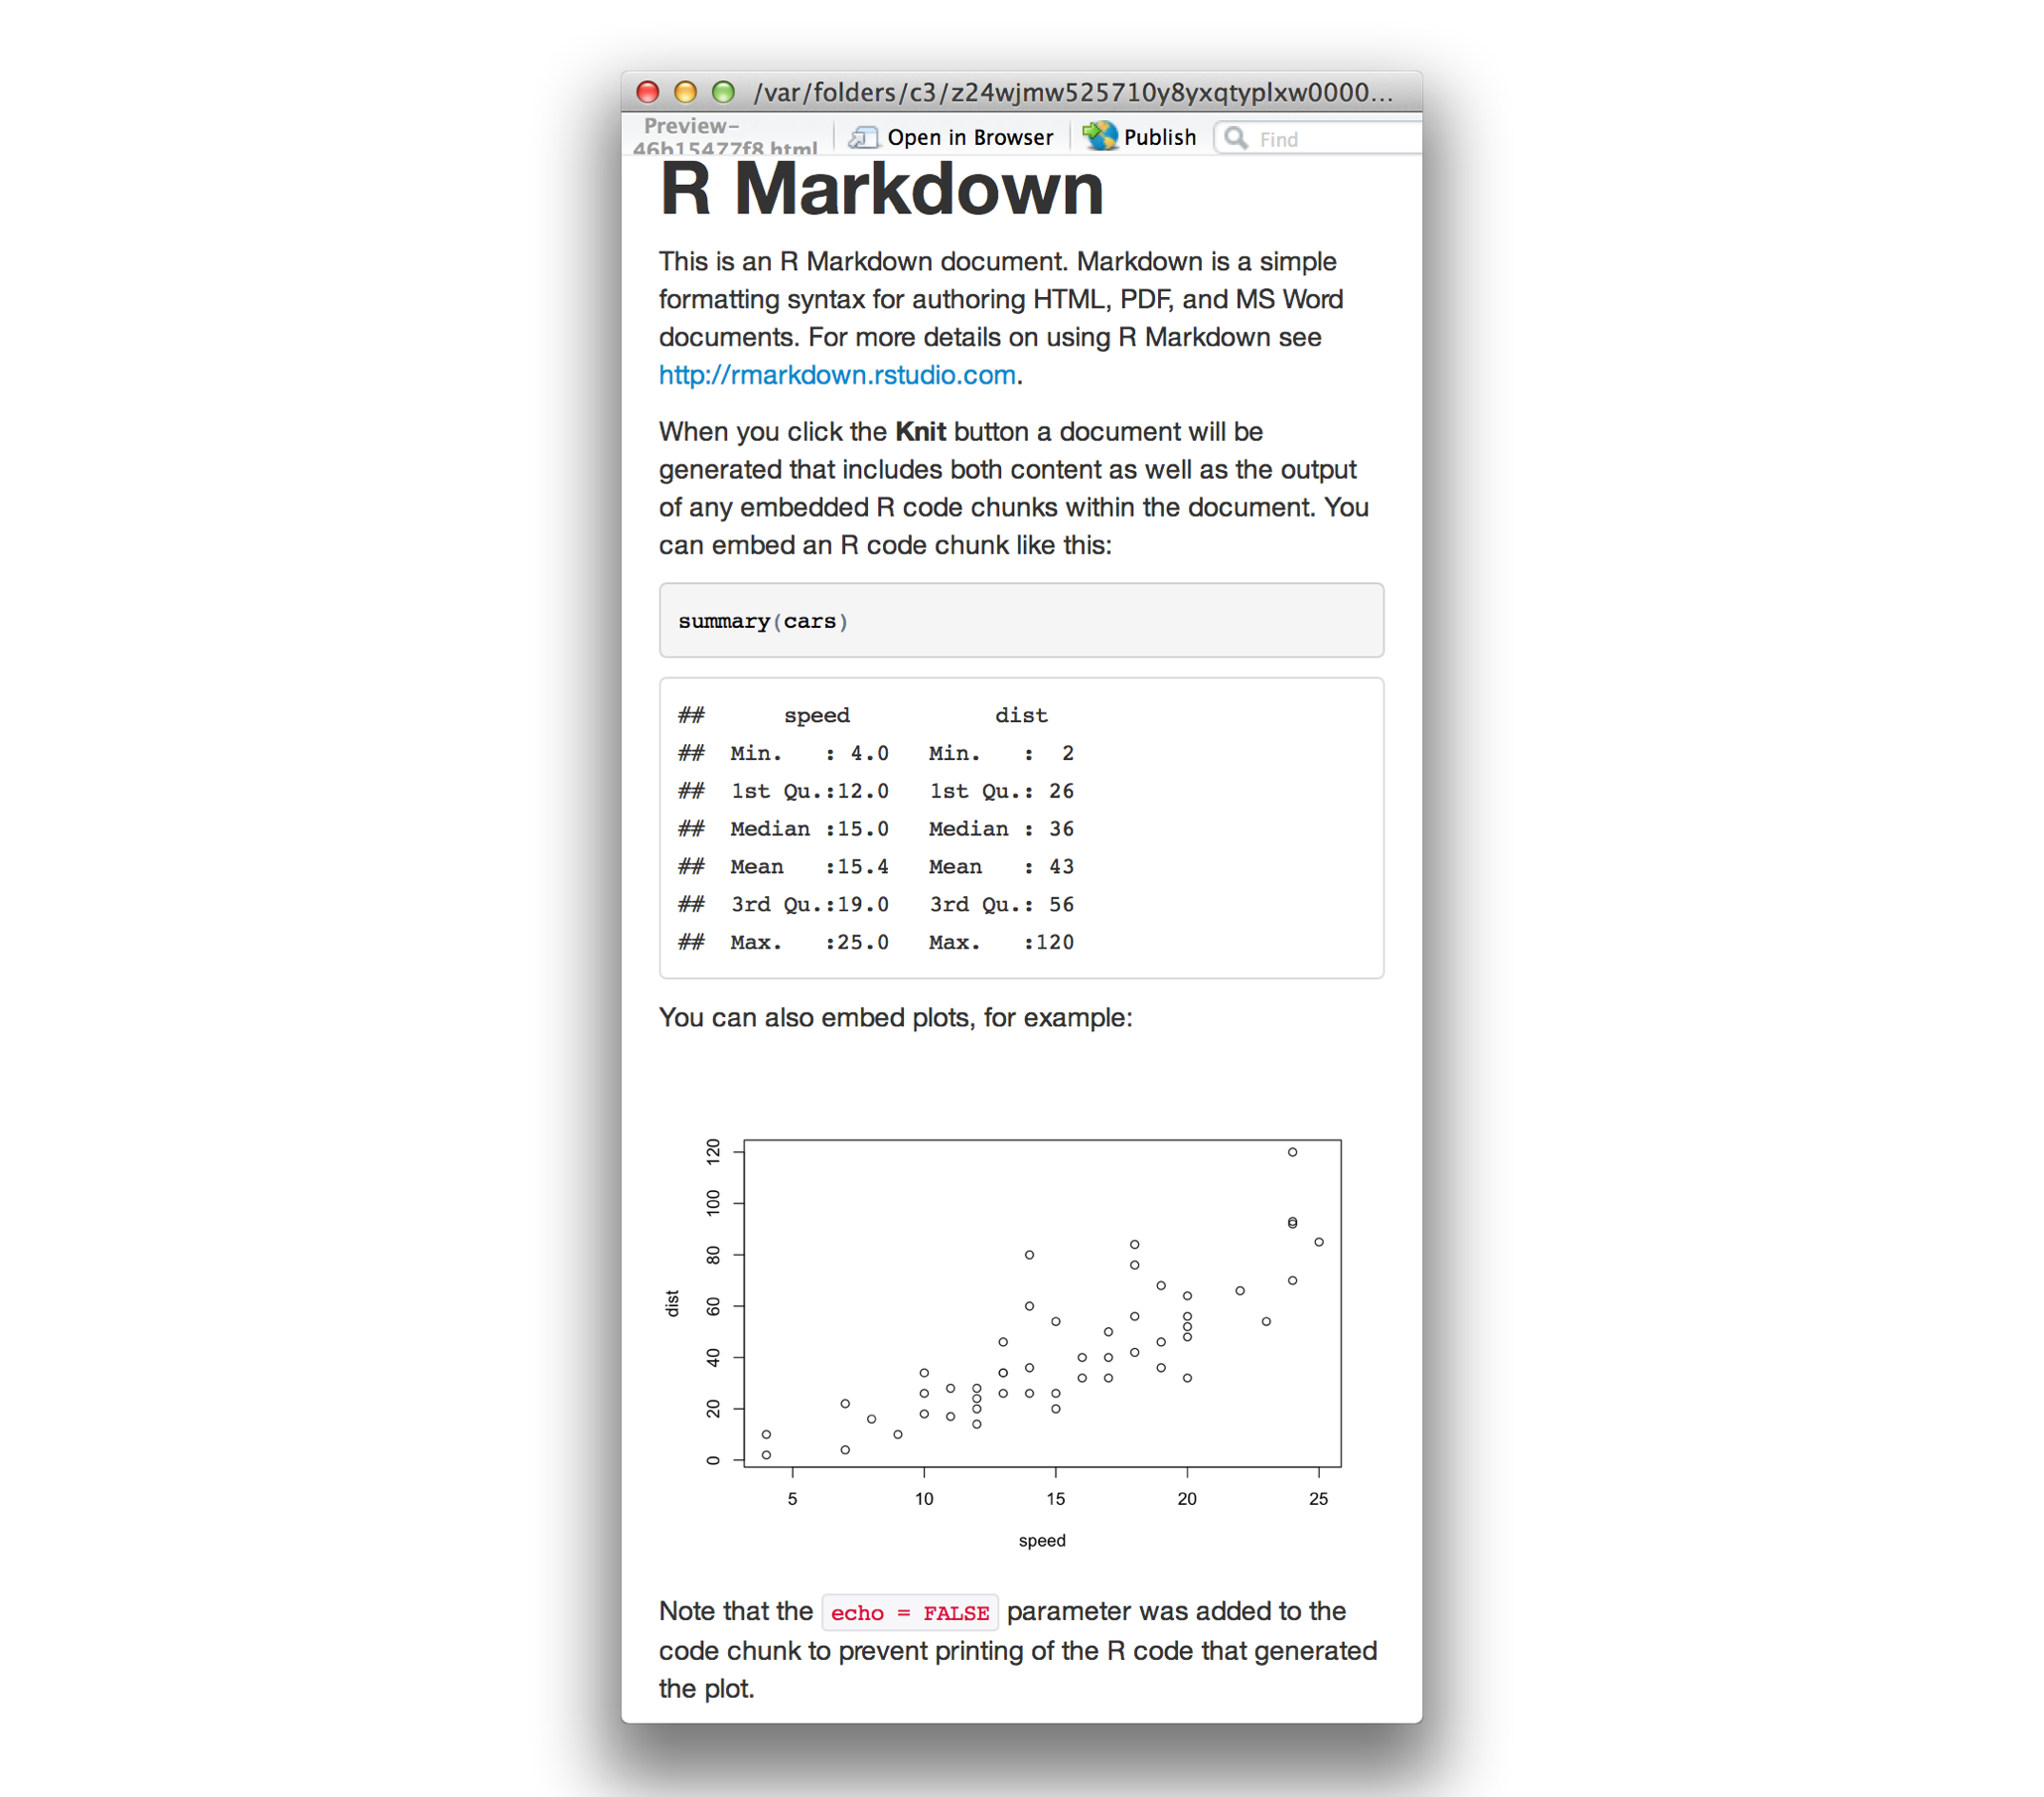
An R Markdown file, for example.
Final Tips
Focus on quality over quantity. Two to three diverse, polished projects will be more valuable than ten repetitive, low-quality ones. Most people will spend only a couple of minutes looking at your work (if at all).
Write for a general audience. Your explanations and results should be understandable to someone who is not an expert in your field. Clear communication is a valuable skill in its own right, and you’re able to demonstrate your ability to condense complex information.
Tailor your project to your target industry. Relevant projects can show hiring managers that you’re familiar with industry terminology and standard analytical approaches in that field.
A portfolio will not guarantee you an interview and not every hiring manager will look at it. However, when someone does click that link, your portfolio can provide evidence of technical ability, communication skills, and initiative beyond what a resume alone can show. Good luck!